Intent of this Workspace
This workspace is intended for the project timesheets users. This task based workspace allows users to quickly navigate to manage pending time, timesheet and forms where timesheet related information can be configure or viewed. Also, there are few metrics on this workspace which helps us to analyze our own utilization data. The delegate functionality has been enabled on this form to quickly view and take actions for the people you are delegated to.
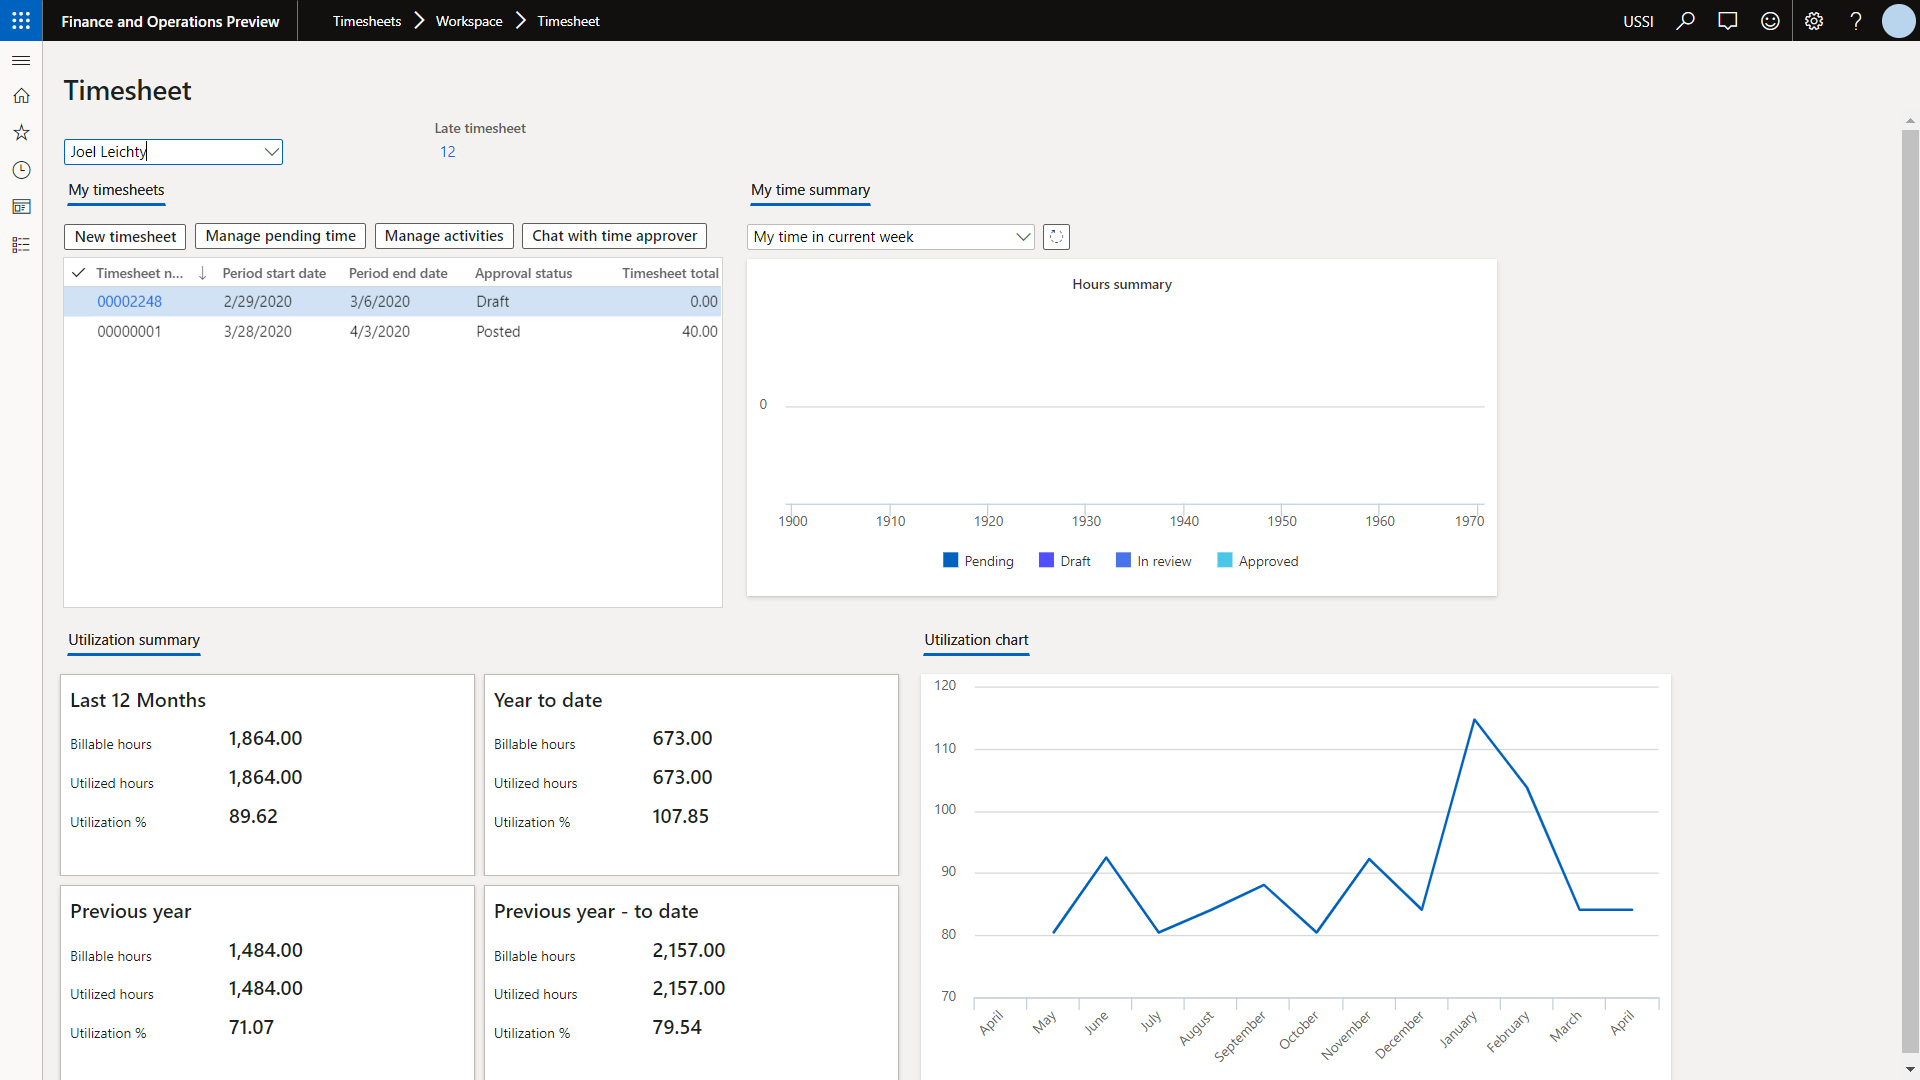
1. My timesheets
This section lists out all the recent timesheets for the logged in resource or the selected resource. These timesheets will be arranged in descending order by date. There are navigation buttons on top of the grid to enable quick navigation to the relevant forms. Details of some of the navigation options provided are as follows –
| Buttons | Description |
| New Timesheet | Allows to quickly create timesheet by directly opening the new timesheet slide out form. |
| Manage pending time | Allows to quickly open the manage pending time form, this button will not be visible for the delegated resource. |
| Manage activities | Allows to quickly open my project activities form, this button will not be visible for the delegated resource. |
| Chat with time approver | Allows to chat with the time approver for the selected line. |
2. My time summary
This section shows the time entered by the logged-in or selected resource in various statuses. This visual picks the time from manage pending time and timesheets form. There are 2 options available on the drop-down on top of visual and can be selected to see the time entered for current or previous weeks. Also if you navigated to another form and coming back on this form, refresh button can be used to quickly refresh the visual.
The legends at the bottom of the visual can clicked to turn them on or off, hence these legends can be utilized as filters to see data in different statuses.
3. Utilization summary
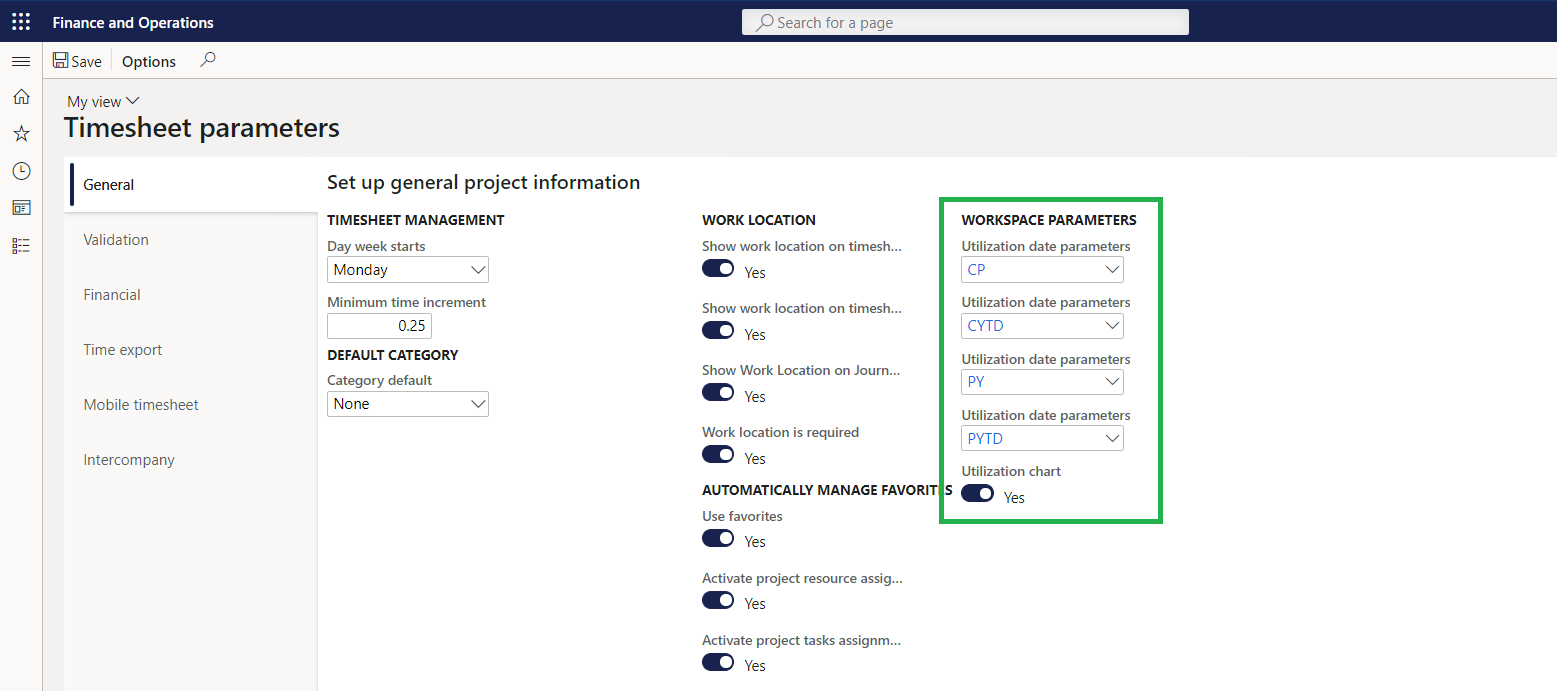
This is a configurable visual showing the utilization data in four different boxes. Each box can be configured to show up on this form. Users need to setup the date interval codes on the timesheet parameters form in order to calculate and display data on this form. The number of boxes display here depends on how many is configured on the parameter as shown in the below visual.
3. Utilization chart
This visual shows the utilization data in a line graph for the logged-in or the selected resource. By default, the utilization data for last 12 months is shown here. A checkbox to turn off this visual is provided in the parameter as shown in the below visual.
The parameters for section 3 and 4 can be configured on the following location
Go to Timesheets > Setup > Timesheet parameters